

Overview
The agent can draw two kinds of figures right in the chat:- Charts of numbers, from your files, a spreadsheet, a CSV, or figures you give it. Point at a chart to see the exact values.
- Diagrams of how things connect or happen in order: a process, a timeline, a project plan, an org of ideas.
Charts
Chart types
If you don’t name a type, the agent picks the one that fits the question. For example, it uses a line for anything over time, and usually a sorted bar chart rather than a pie.
How to ask
Open the folder with your data, open the agent, and say what you want to see.Good to know
- A chart shows a summary. The agent groups and totals the data first, such as by month or by vendor, rather than plotting every row. A long list of categories becomes the top ones plus “Other”.
- Each currency is kept separate. Amounts in different currencies are never added together.
- One scale per chart. Two measures on very different scales, such as revenue and headcount, become two charts.
- Up to 5,000 rows of data. For more, the agent totals the data first.
Diagrams
Diagram types
It can also draw pie charts, user journeys, kanban boards, and architecture and requirement diagrams.
How to ask
The figure card
A figure appears in the chat as a card, drawn at the width of the panel. Below it are its title, its type and its size, such as “bar · 12 rows”.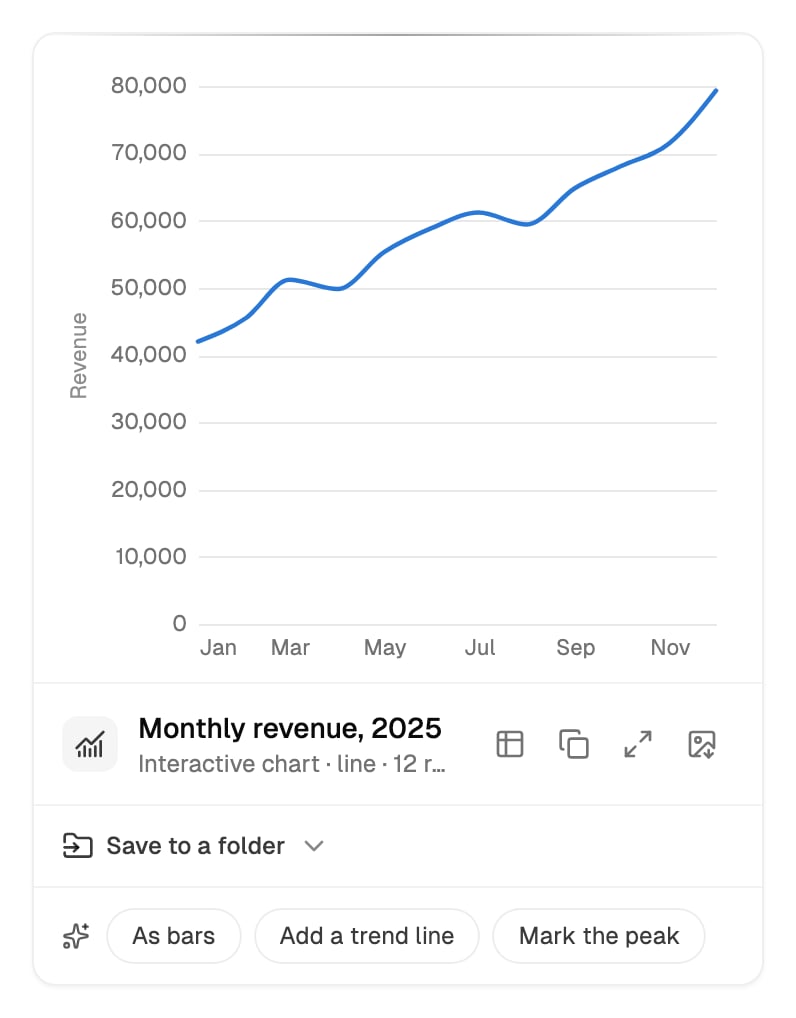
Under the newest figure in the chat, the agent offers a few follow-ups, such as As bars, Top 5 only, Add a trend line or Simplify it. Click one to send it as your next message.
Like other files the agent makes, a figure you don’t save stays in the chat for 30 days. See Document Creation.
Saved figures
A figure is saved as a small file:
When you open one in The Drive AI, it’s drawn just as it was in the chat. Switch between Rendered and Source to see the figure or the text that describes it. Click PNG to download a picture, or Download for the file itself.
Other tools that understand Vega-Lite or Mermaid can open these files too. To put a chart into a document or slide deck, use Copy picture or Download as PNG, or ask the agent to make the document with the chart in it.
Changing a chart or diagram
Ask for the change in the chat. The agent draws a new figure, as a new card, and keeps the earlier one in the chat.Tips
Say what the chart should answer
Say what the chart should answer
“Which vendors cost us the most this year?” gets a better chart than “chart the invoices”. The agent puts the answer in the title, such as “Spend by vendor, 2025”.
Name the file or folder
Name the file or folder
“From sales-2025.csv” or “from the invoices in /Finance/2025” tells the agent exactly where the numbers come from.
Check the numbers
Check the numbers
Click Show the data to see exactly which values the chart draws.
What’s next?
Document Creation
Make PDFs, Word documents, spreadsheets and decks.
Conversations
Work with the agent over a conversation.