> ## Documentation Index
> Fetch the complete documentation index at: https://docs.thedrive.ai/llms.txt
> Use this file to discover all available pages before exploring further.
# Charts and Diagrams
> Ask the agent for interactive charts of your numbers and diagrams of processes, timelines and relationships, then copy, download or save them
## Overview
The [agent](/agent/overview) can draw two kinds of figures right in the chat:
* **Charts** of numbers, from your files, a spreadsheet, a CSV, or figures you give it. Point at a chart to see the exact values.
* **Diagrams** of how things connect or happen in order: a process, a timeline, a project plan, an org of ideas.
A figure is a file like any other the agent makes. It stays in the chat until you save it to a folder, and you can copy it as a picture, download it as a PNG, or ask the agent to change it.
## Charts
### Chart types
| Chart | Good for |
| - | - |
| **Bar** | Comparing amounts across categories, such as spend by vendor. Horizontal when the labels are long. |
| **Line** | Change over time, such as revenue by month. |
| **Area** | A total over time that's made of parts. |
| **Pie** | Parts of a whole, with a few parts. |
| **Scatter** | Two measures for each item, such as deal size against days to close. |
| **Heatmap** | A measure across two categories, such as sales by region and month. |
| **Box plot and histogram** | How values are spread out. |
If you don't name a type, the agent picks the one that fits the question. For example, it uses a line for anything over time, and usually a sorted bar chart rather than a pie.
### How to ask
Open the folder with your data, open the agent, and say what you want to see.
```text theme={null}
Chart our monthly revenue for 2025 from sales.csv
```
```text theme={null}
Show spend by vendor from the invoices in this folder, top 10 only
```
```text theme={null}
Make a pie chart of the budget by department from budget.xlsx
```
```text theme={null}
Plot deal size against days to close for every deal in the pipeline export
```
```text theme={null}
Chart these numbers: Q1 120, Q2 145, Q3 160, Q4 190
```
The agent takes the numbers from your files, never from memory. After drawing the chart, it tells you in a line what the chart shows and where the numbers came from, including anything it left out.
It can chart numbers it pulls out of many documents too, such as the total of every invoice in a folder. It reads the documents first, then charts the totals.
### Good to know
* **A chart shows a summary.** The agent groups and totals the data first, such as by month or by vendor, rather than plotting every row. A long list of categories becomes the top ones plus "Other".
* **Each currency is kept separate.** Amounts in different currencies are never added together.
* **One scale per chart.** Two measures on very different scales, such as revenue and headcount, become two charts.
* **Up to 5,000 rows of data.** For more, the agent totals the data first.
## Diagrams
### Diagram types
| Diagram | Good for |
| - | - |
| **Flowchart** | A process, a workflow, or how a decision is made. |
| **Sequence diagram** | Who passes what to whom, in order. |
| **Timeline** | When things happened or will happen. |
| **Gantt chart** | A project plan's tasks over dates. |
| **Mind map** | A topic broken into parts. |
| **Entity diagram** | How records relate, such as clients, matters and invoices. |
| **Class diagram** | How concepts or parts of a system relate. |
| **State diagram** | The stages something moves through, such as a contract's status. |
| **Quadrant chart** | Items placed on two axes, such as effort against impact. |
| **Sankey diagram** | Flows of an amount, such as where the budget goes. |
It can also draw pie charts, user journeys, kanban boards, and architecture and requirement diagrams.
### How to ask
```text theme={null}
Draw a flowchart of our invoice approval process from the policy document
```
```text theme={null}
Make a timeline of the key dates in this contract
```
```text theme={null}
Create a Gantt chart of the website project plan
```
```text theme={null}
Draw a mind map of the topics in this research folder
```
```text theme={null}
Show how the workflows in this workspace hand files to each other
```
When a diagram describes your own files or workflows, the agent builds it from what it reads in the workspace.
Keep a diagram to about 30 boxes so it stays readable. For something bigger, ask for two diagrams, such as an overview and a detail.
## The figure card
A figure appears in the chat as a card, drawn at the width of the panel. Below it are its title, its type and its size, such as "bar · 12 rows".
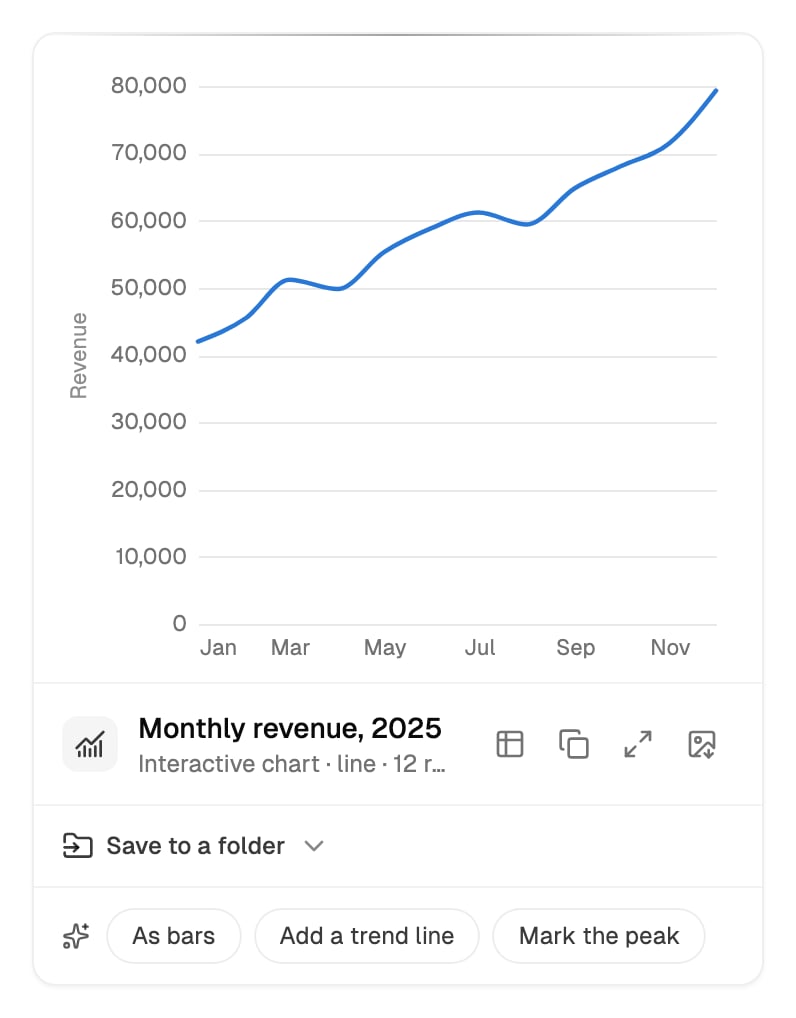 | Button | What it does |
| - | - |
| **Show the data** | Charts only. Shows the numbers behind the chart as a table. Click **Show the chart** to go back. |
| **Download CSV** | Charts only, while the table is showing. Downloads the numbers as a CSV file. |
| **Copy picture** | Copies the figure as a picture, to paste into a document, a deck or a message. If your browser won't copy it, download it instead. |
| **Open full size** | Opens the figure in a larger view, with **PNG** and **Download** buttons. |
| **Download as PNG** | Downloads the figure as a PNG picture. |
| **Save to a folder** | Saves the figure as a file in your workspace or a connected drive. The card then shows **Saved to** with its path. |
Under the newest figure in the chat, the agent offers a few follow-ups, such as **As bars**, **Top 5 only**, **Add a trend line** or **Simplify it**. Click one to send it as your next message.
Like other files the agent makes, a figure you don't save stays in the chat for 30 days. See [Document Creation](/features/document-creation#how-long-files-stay-in-the-chat).
## Saved figures
A figure is saved as a small file:
| Figure | File type | Example name |
| - | - | - |
| Chart | `.vl.json` (a Vega-Lite chart) | Revenue by month, 2025.vl.json |
| Diagram | `.mmd` (a Mermaid diagram) | Onboarding flow\.mmd |
When you open one in The Drive AI, it's drawn just as it was in the chat. Switch between **Rendered** and **Source** to see the figure or the text that describes it. Click **PNG** to download a picture, or **Download** for the file itself.
Other tools that understand Vega-Lite or Mermaid can open these files too. To put a chart into a document or slide deck, use **Copy picture** or **Download as PNG**, or ask the agent to make the document with the chart in it.
## Changing a chart or diagram
Ask for the change in the chat. The agent draws a new figure, as a new card, and keeps the earlier one in the chat.
```text theme={null}
Show that as a line chart instead
```
```text theme={null}
Split it by quarter instead of by month
```
```text theme={null}
In the onboarding flowchart, add a step for the welcome call
```
For a chart, the agent reuses the numbers from the first chart, so the figures stay the same unless you ask for different data. If you saved the earlier version to a folder, save the new one too. The saved file doesn't change on its own.
## Tips
"Which vendors cost us the most this year?" gets a better chart than "chart the invoices". The agent puts the answer in the title, such as "Spend by vendor, 2025".
"From sales-2025.csv" or "from the invoices in /Finance/2025" tells the agent exactly where the numbers come from.
Click **Show the data** to see exactly which values the chart draws.
## What's next?
Make PDFs, Word documents, spreadsheets and decks.
Work with the agent over a conversation.
This documentation is built and hosted on [Mintlify](https://mintlify.com), a developer documentation platform.
| Button | What it does |
| - | - |
| **Show the data** | Charts only. Shows the numbers behind the chart as a table. Click **Show the chart** to go back. |
| **Download CSV** | Charts only, while the table is showing. Downloads the numbers as a CSV file. |
| **Copy picture** | Copies the figure as a picture, to paste into a document, a deck or a message. If your browser won't copy it, download it instead. |
| **Open full size** | Opens the figure in a larger view, with **PNG** and **Download** buttons. |
| **Download as PNG** | Downloads the figure as a PNG picture. |
| **Save to a folder** | Saves the figure as a file in your workspace or a connected drive. The card then shows **Saved to** with its path. |
Under the newest figure in the chat, the agent offers a few follow-ups, such as **As bars**, **Top 5 only**, **Add a trend line** or **Simplify it**. Click one to send it as your next message.
Like other files the agent makes, a figure you don't save stays in the chat for 30 days. See [Document Creation](/features/document-creation#how-long-files-stay-in-the-chat).
## Saved figures
A figure is saved as a small file:
| Figure | File type | Example name |
| - | - | - |
| Chart | `.vl.json` (a Vega-Lite chart) | Revenue by month, 2025.vl.json |
| Diagram | `.mmd` (a Mermaid diagram) | Onboarding flow\.mmd |
When you open one in The Drive AI, it's drawn just as it was in the chat. Switch between **Rendered** and **Source** to see the figure or the text that describes it. Click **PNG** to download a picture, or **Download** for the file itself.
Other tools that understand Vega-Lite or Mermaid can open these files too. To put a chart into a document or slide deck, use **Copy picture** or **Download as PNG**, or ask the agent to make the document with the chart in it.
## Changing a chart or diagram
Ask for the change in the chat. The agent draws a new figure, as a new card, and keeps the earlier one in the chat.
```text theme={null}
Show that as a line chart instead
```
```text theme={null}
Split it by quarter instead of by month
```
```text theme={null}
In the onboarding flowchart, add a step for the welcome call
```
For a chart, the agent reuses the numbers from the first chart, so the figures stay the same unless you ask for different data. If you saved the earlier version to a folder, save the new one too. The saved file doesn't change on its own.
## Tips
"Which vendors cost us the most this year?" gets a better chart than "chart the invoices". The agent puts the answer in the title, such as "Spend by vendor, 2025".
"From sales-2025.csv" or "from the invoices in /Finance/2025" tells the agent exactly where the numbers come from.
Click **Show the data** to see exactly which values the chart draws.
## What's next?
Make PDFs, Word documents, spreadsheets and decks.
Work with the agent over a conversation.
This documentation is built and hosted on [Mintlify](https://mintlify.com), a developer documentation platform.